

Error Monitoring and Sentry
How do you track errors and issues with your web projects? In this post, we'll explore how you can monitor your projects for errors and how the Sentry service can help visualize and speed up debugging

 - VectorLogoSeek.Com")
How many times have you gone down the rabbit hole of trying to troubleshoot and identify bugs and errors within your code? Sometimes, you’re not even sure where to begin because the error coming through is so vague or doesn’t have any relation to what you’re working on.
The good news, is that there are tools out there to help identify, track and narrow down the causes and notify you of errors. The bad news… is that there’s nothing that will 100% narrow down every single error that comes up and gives you a solution straight away for all your debugging issues. However, Sentry.io is a great place to start and help you watch out and track issues.
In this post we’ll go through a couple handy things that I’ve been using with Sentry and it’s even helpful when you’re building your app in development, not just in production.
What is Sentry.io?
In a nutshell, Sentry is a service to track errors and monitor your applications performance. It originally started as an open-source project and a lot of their features and offerings are still great on a free tier plan.
You can link your project (and they have a huge range of various technologies that it can integrate with) to their services that allow you to track live error monitoring, as well as performance of your application, that can send you live alerts when events are triggered. They also have a new feature called Replay which is great when setup correctly and you can monitor the interaction of your users when errors occur to help with troubleshooting bugs.
They try and keep it as simple as possible to integrate and monitor events.
Key Features
There are various features that Sentry.io can help with in your projects and I’ll run through a couple of the main features that I use regularly, in all stages of the Software Delivery Lifecycle (SDLC).
Error Monitoring
Sentry offers comprehensive error monitoring, capturing and logging errors as they occur in real time. This allows developers to quickly identify the root cause of issues and take corrective action.
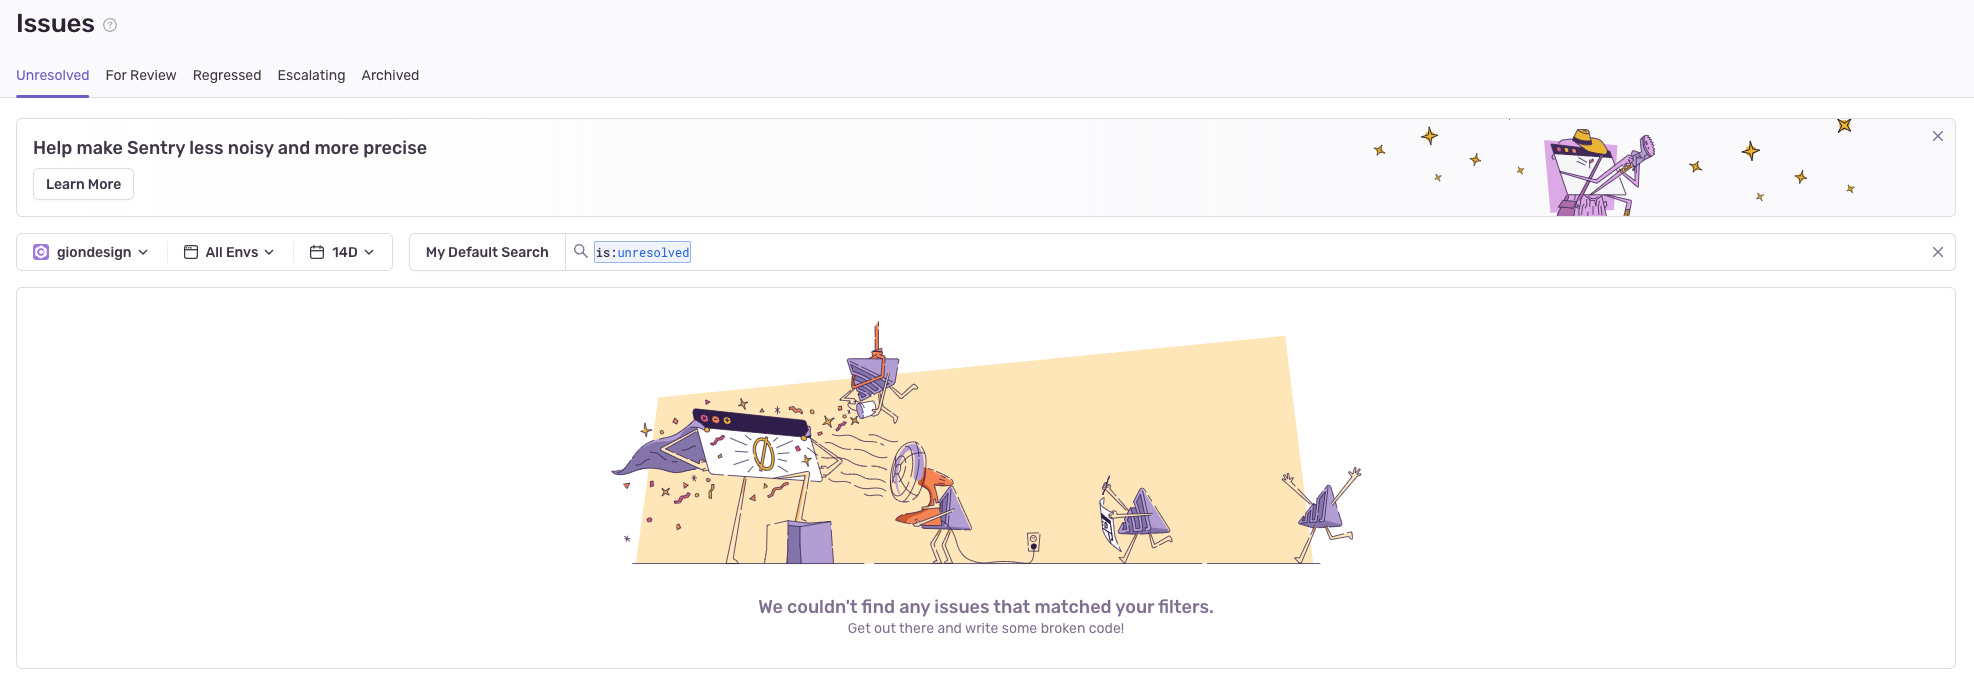
They also have fun little cartoons when you have successfully cleared out all your issues and errors to give a little motivational boost, which I think is a little bit of fun too.
And when creating and linking a new project with Sentry, they have a large range of application types and guides to step you through connecting the service you need.
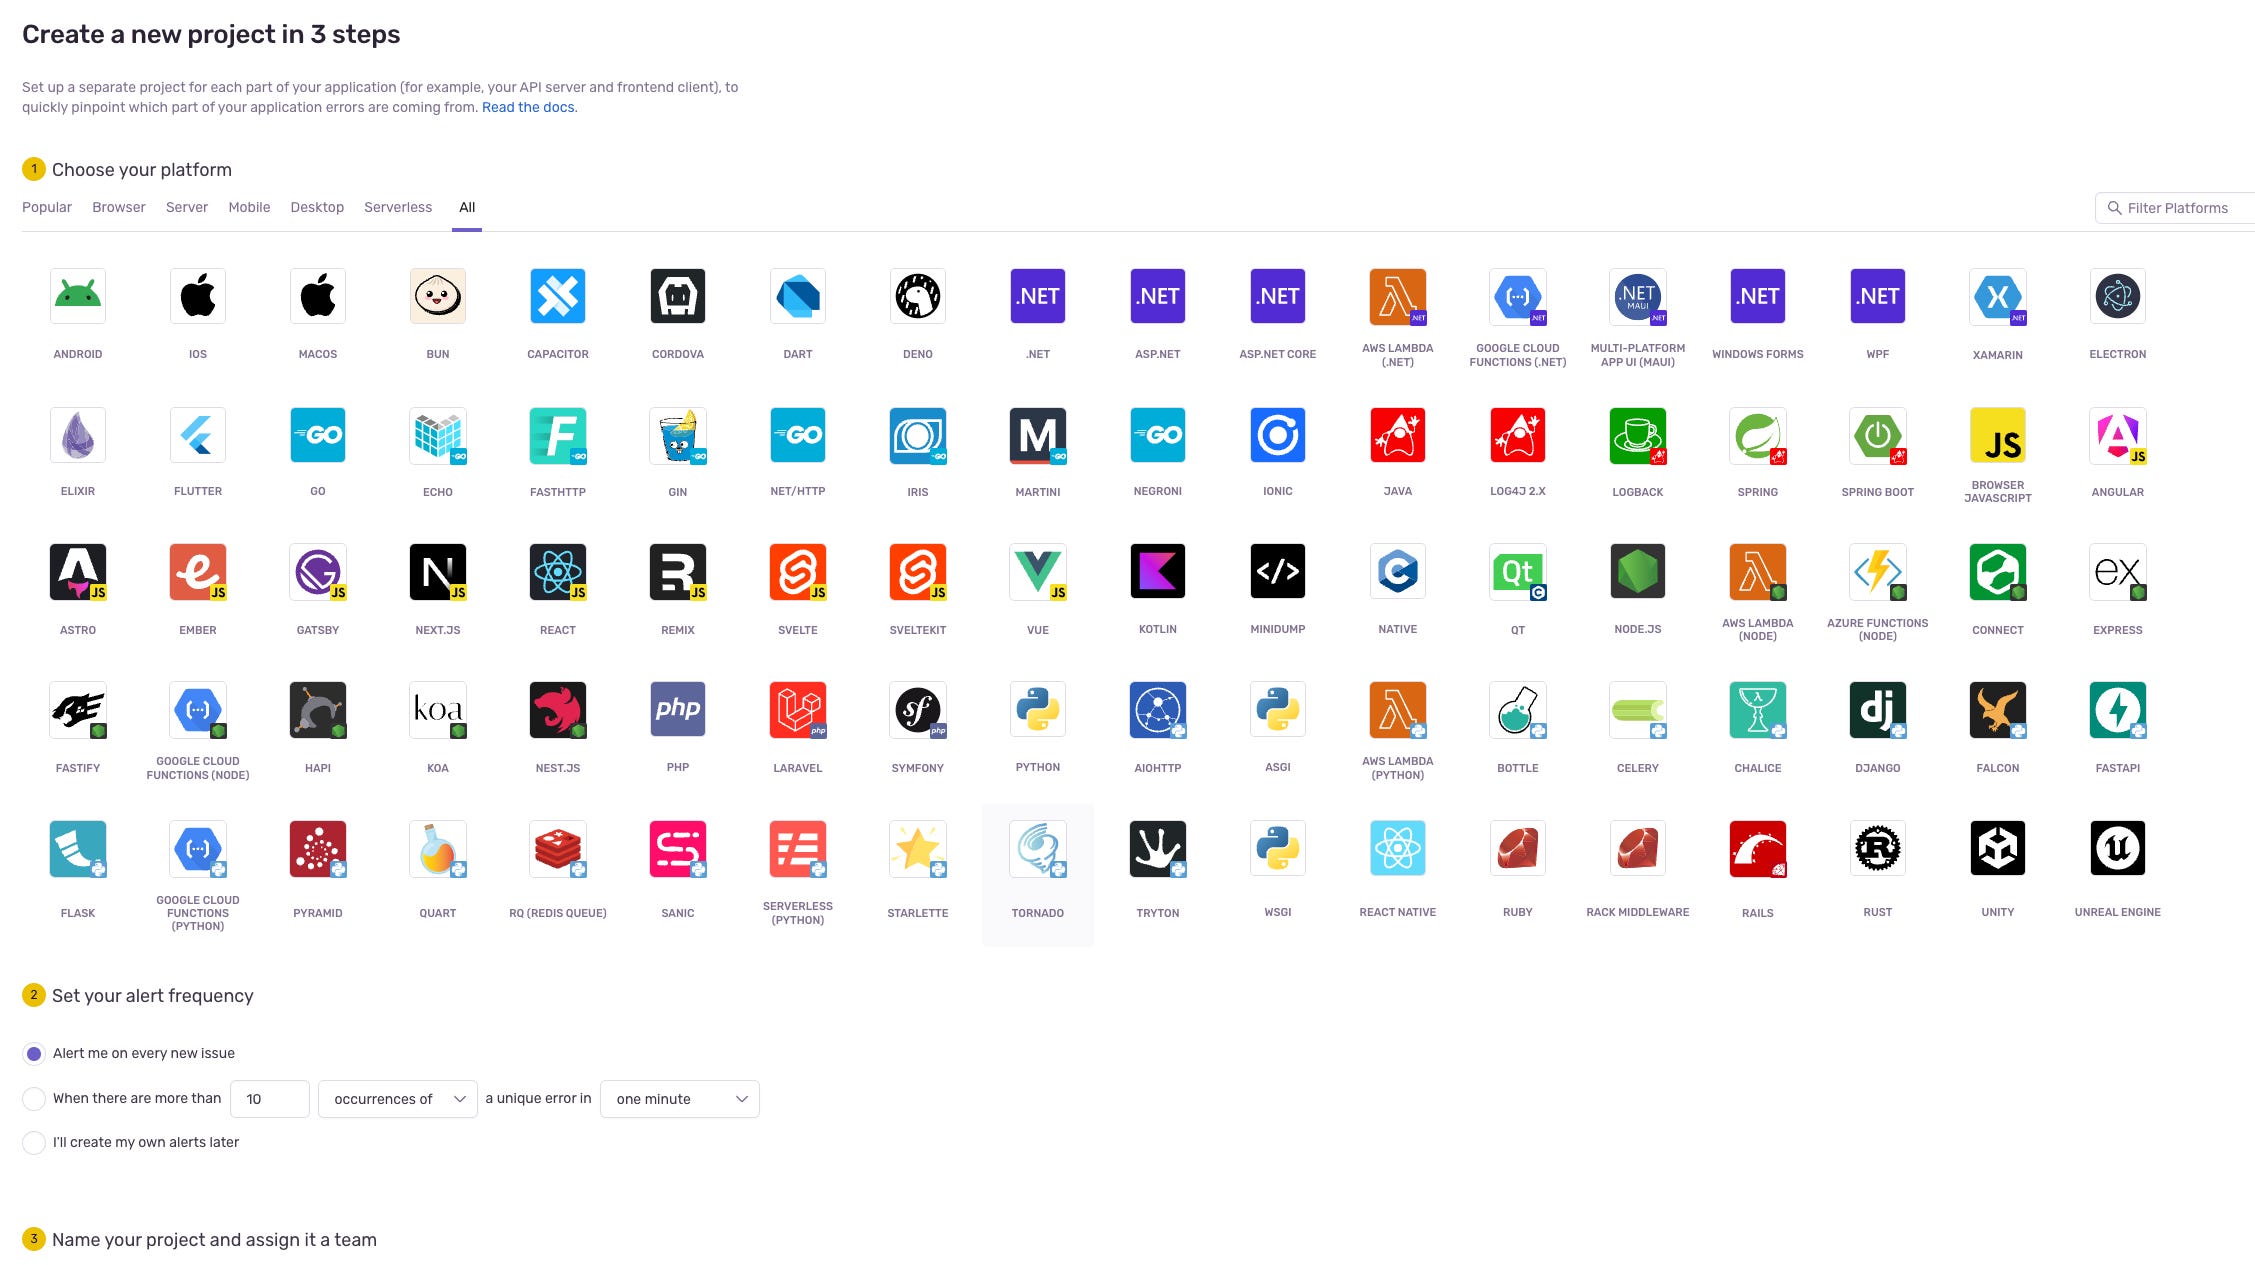
I’ve used it in iOS, .NET, ASP.NET Core, Javascript, React and Vue.js projects, even during development phase which can help identify issues in advance before deploying and you can break down the errors based on environment and domain to filter them to what you need.
After selecting your code base, it has a simple guide to setup the integration and test it, here’s one after I created a test Vue.js project in Sentry
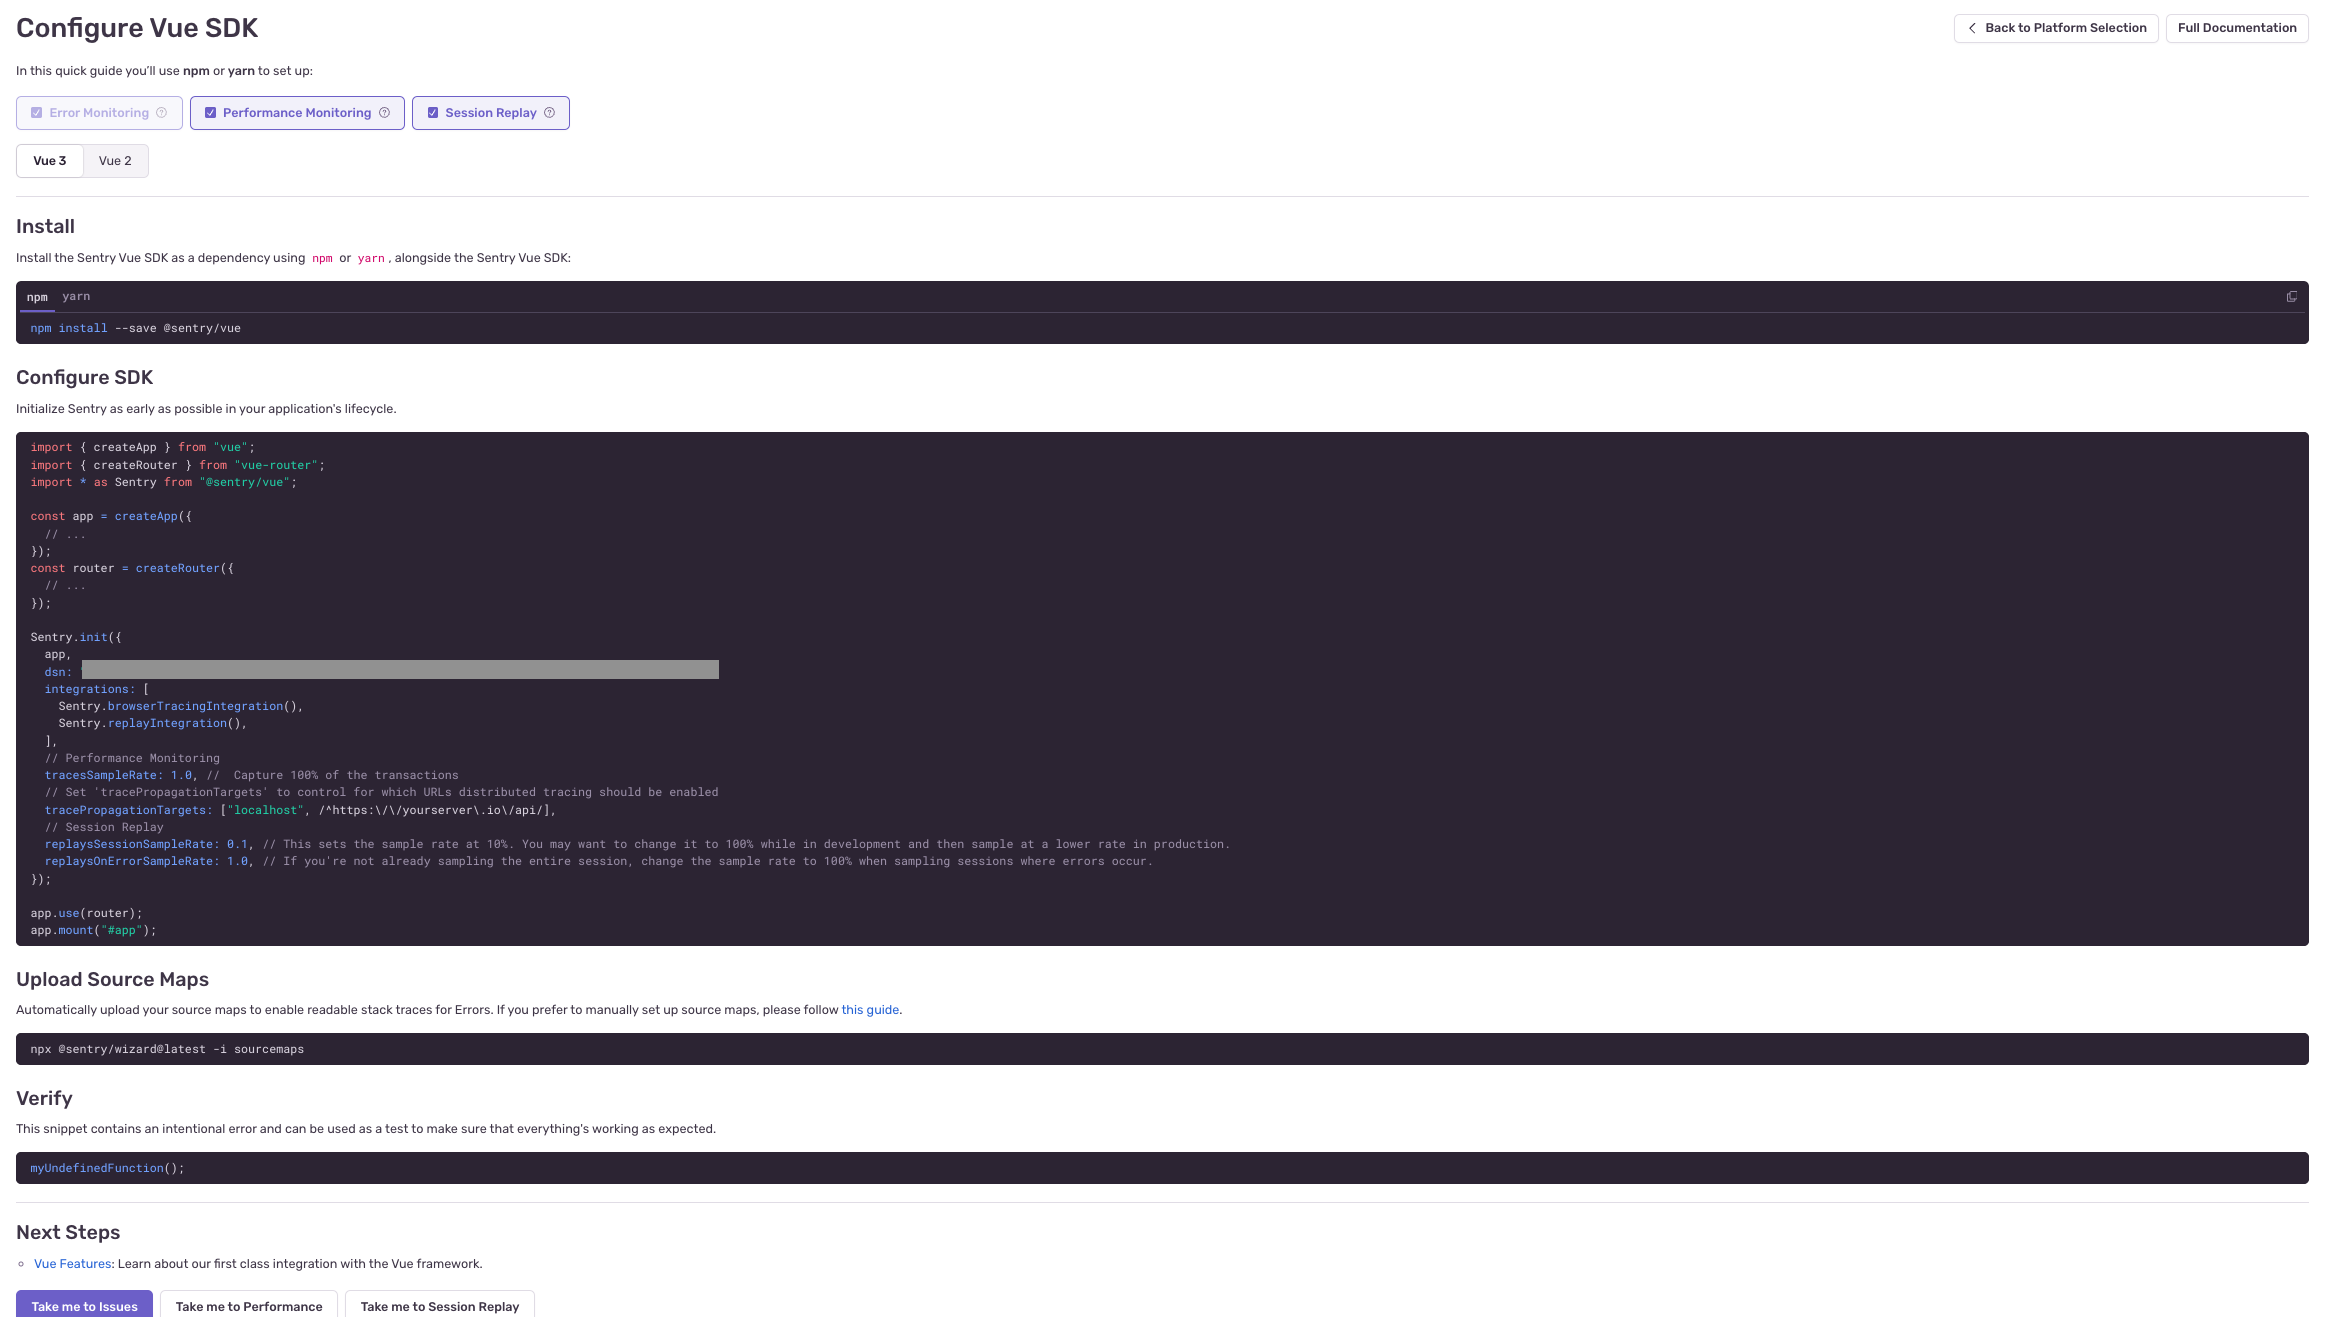
You can get very detailed stack traces, from handled AND unhandled exceptions too.
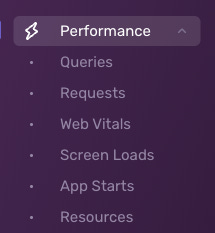
Performance Monitoring
You can also setup configuration, depending on your project type, to monitor the performance of your project, such as identifying slow database queries, long API responses and other performance bottlenecks that may occur.
Real-Time Alerts
When there’s an error being logged in sentry, you can customise the notifications to make sure that anyone who needs to know what’s going on can be alerted, be it in a MS Teams channel, Slack chat, Email or SMS and others as well.
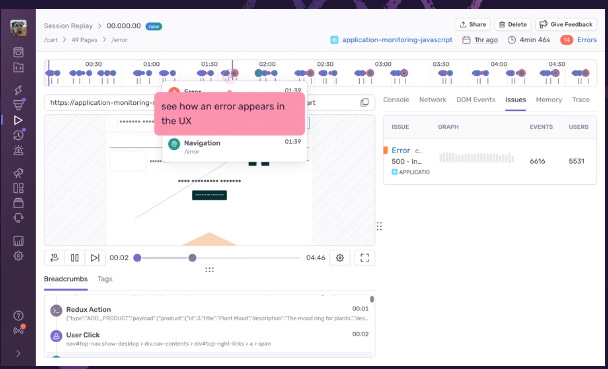
Session Replay
This is a relatively newer feature (well it was when i wrote this), but when there’s an error, if you have replay configured, it can take a screen recording around the time the user experiences the error so developers can identify the journey and interactions the user took to help with debugging the errors.
I’ve only started using this a little bit, but it is super handy and they do have precautions to protect users’ privacy as well in fields, forms and data being submitted.
Various Integrations
The team at Sentry have made it super easy to integrate their services with multiple platforms and other software for communication, project management, version control, other monitoring and logging tools.
Their tool integrations can work with:
Version Control Systems: Integrations with GitHub, GitLab, and Bitbucket allow developers to link issues directly to code changes, making it easier to trace the source of errors.
Project Management Tools: Sentry integrates with project management tools like Jira, Trello, and Asana, enabling teams to create and manage issues directly from their workflow tools.
Communication Platforms: Integration with Slack, Microsoft Teams, and PagerDuty ensures that teams can receive real-time alerts and collaborate effectively on resolving issues.
Deployment Tools: Integrations with deployment tools like Jenkins, CircleCI, and Travis CI allow developers to track issues and performance metrics through the entire CI/CD pipeline.
Monitoring and Logging Tools: Sentry can work alongside other monitoring and logging tools like Datadog, New Relic, and Splunk to provide a comprehensive view of application health.
And in terms of the platforms, it’s quite broad, as you can see in one of my earlier screenshots in the Error Monitoring section, there is a full list and it’s constantly expanding.
Summary
All apps require error handling and some form of monitoring and tracking your errors across different environments and situations. Sentry makes it extremely easy to setup and integrate their service into nearly any type of project and platform to allow developers to easily debug and monitor their applications and software performance.
Like i mentioned earlier, it’s not only in the production environments that this is an essential resource, but also during the development phases where it can pickup issues that you may not even be aware of when testing your projects.
With it’s ease of use and free offerings, it’s one of the essential tools to be added to any developers toolkit!